Датчики GEMS DFA8D0
17.01.2025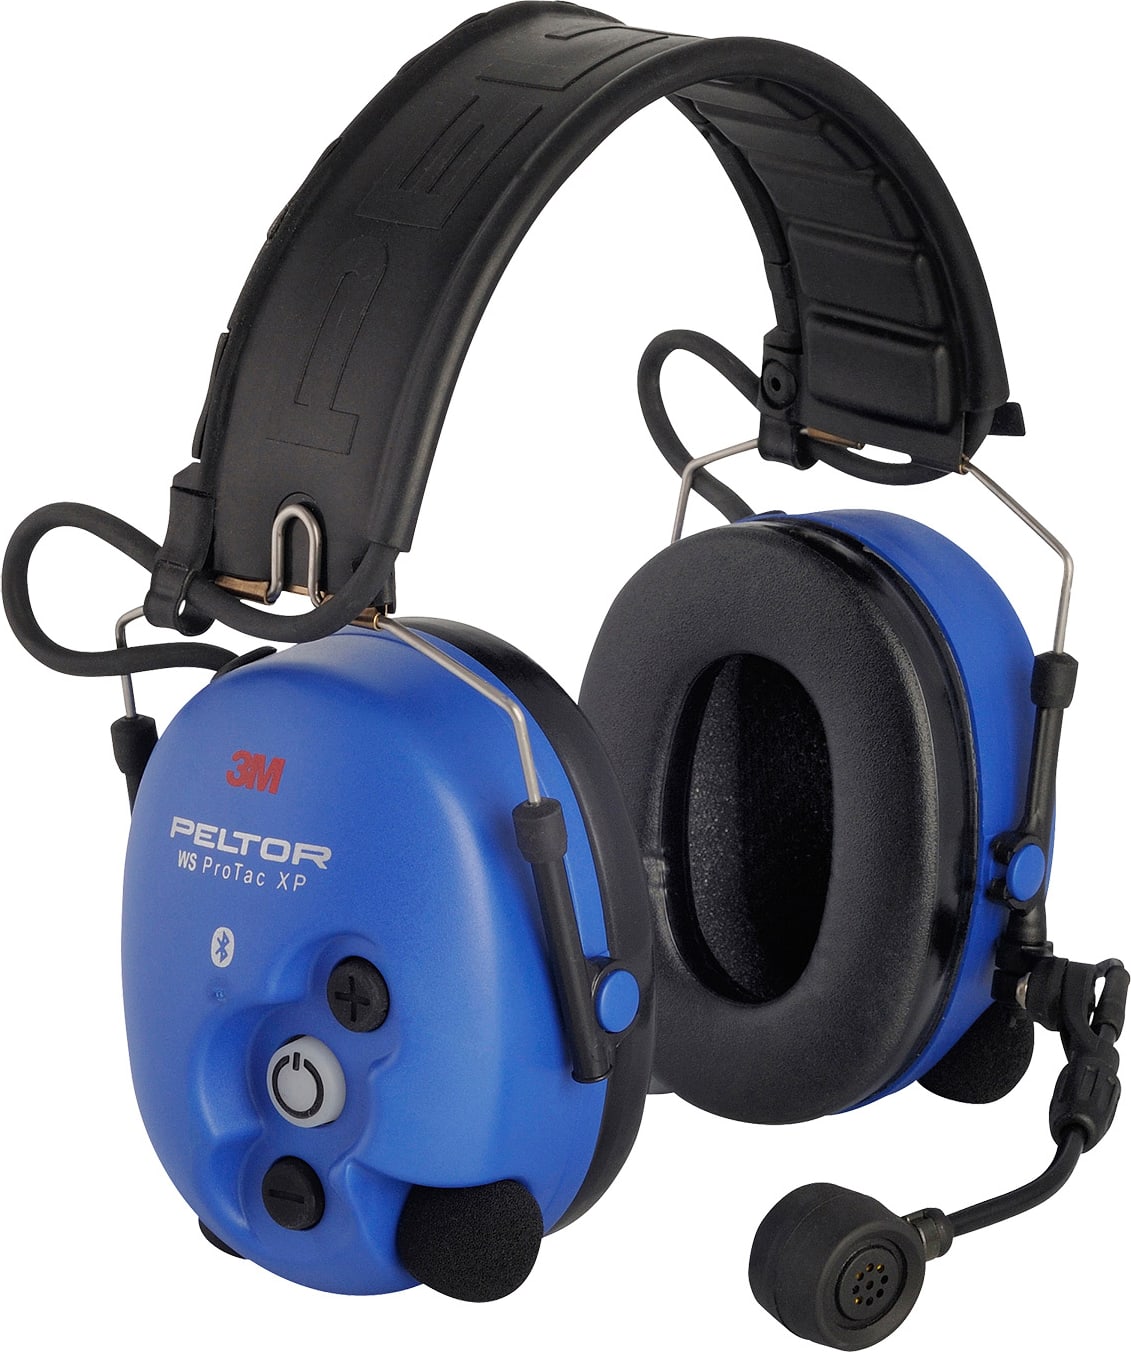
ecom Pro Tac XP ATEX HD Bluetooth Headset (Head)
17.01.2025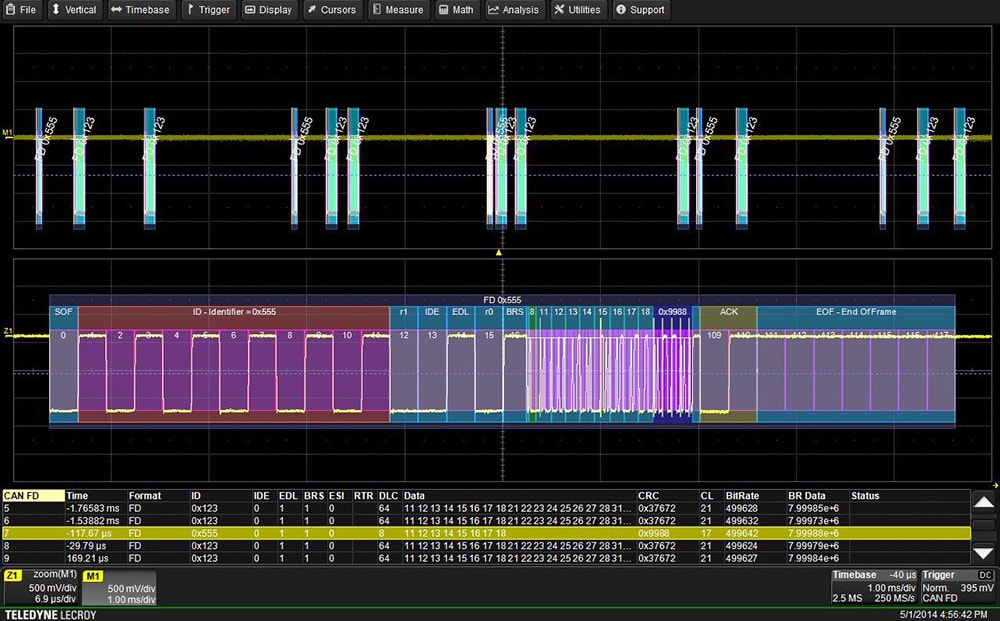
Teledyne LeCroy WS3K-CAN FDBUS TD – CAN FD Trigger and Decode Package
CAN and CAN FD Trigger and Decode Package for WaveSurfer 3000 / 3000z
288000,00 ₽
Description Teledyne LeCroy WS3K-CAN FDBUS TD – CAN FD Trigger and Decode Package
- Comprehensive CAN and CAN FD (non-ISO and ISO) trigger and decode
- Flexible triggering for data, error and remote frames
- Easily view decoded signals with intuitive color-coded decode overlay
- Supports CAN signals up to 1 Mb/s and CAN FD signals up to 10 Mb/s
With CAN and CAN FD trigger and decode the oscilloscope becomes the ideal tool for debugging CAN controllers, busses and systems. Identify and isolate specific frames with ID, Remote and Error frame triggering. Decoding CAN signals provides tremendous insight into activity on the bus, and measurement tools enable fast analysis of bus performance.
CAN FD Trigger Decode Solution The Most Intuitive Decode
Decoded protocol information is color-coded to specific portions of the CAN, CAN FD, and ISO CAN FD frame, and displayed directly on top of physical layer signals creating an intuitive and easy-to-understand visual display. The decoded information adjusts as the horizontal scale is changed to always provide the right amount of detail in both short and long acquisitions.
Measure and Plot Bus Performance
Powerful measurements and sophisticated statistical, graphical, and plotting tools simplify CAN system debugging. Understanding CAN bus problems and performance is quick and easy.
Powerful CAN Triggering
The CAN and CAN FD trigger will isolate Frame IDs, specific data packets, remote frames or error frames. For CAN FD signals, the oscilloscope can trigger on both ISO and non-ISO variants as well as specific frames with the Bit Rate Shift (BRS) bit. Powerful, conditional triggering enables triggering on a range of events such as a series of Frame IDs or data messages.
Analyze the Symbolic Layer
Importing a .dbc file allows for decoding, triggering, and measurements to be performed directly on the Symbolic (Application) layer, enabling an easier to understand CAN toolset.
TIme Saving Analysis and Debug Tools Timing and Bus Measurements
CAN and CAN FD specific measurement parameters allow you to quickly and easily characterize a system and make gateway measurements. Measure the time between two messages on the bus or from a CAN message to analog signal. Measurement statistics and histicons provide insight into the range of measurements on the bus.
Data Extraction and Graphing
Extract data from the CAN and CAN FD message streams and use track functions to graphically plot the data. Measured values are used to convert digital information into an analog waveform for easy comparison to other electrical signals.
Information on the steering angle and steering angle rate of change
is extracted from the CAN message acquisition, rescaled to decimal values,
and plotted as a time-correlated “Track”
Interactive Table Display Summarizes Results
Turn the oscilloscope into a protocol analyzer with the table display of decoded information. Customize the table to show only the data of interest and touch a message in the table to automatically display it on the screen. Export the table for offline analysis.
Display decoded values in an easy-to-understand table. Values can be displayed in
either hexadecimal or symbolic formats. Filter decoded values to isolate information of interest.
Time Saving Search
Search through long records of decoded CAN data for specific Frame IDs, data values, frame types or status bits.
Search through long records of decoded data by entering specific message or frame details.
Похожие товары
-
Уплотнитель для патрона лампы PT 359030106
11,38 ₽Приобрести 359030106 можно от 1 штуки в Москве. Производитель – AFFINITY MEDICAL TECHNOLOGIES, подразделение A MOLEX COMPANY.
На складе доступно 810116 шт. -
03540523З (ПРЕДОХРАНИТЕЛЬ АКС МОДУЛЬ)
53,73 ₽Приобрести 03540523Z от 1 штуки в Москве. Производитель HAMLIN / LITTELFUSE.
На складе имеется 178252 шт. -
Термальная сигнальная лампа 12V 2TERM 0FLR536/552
785,05 ₽Приобретите 0FLR536/552 от одной штуки в Москве. Производитель HAMLIN / LITTELFUSE.
На складе доступно 6829 штук.